

Evaluating energy consumption in wireless sensor networks
autorzy:
Adam Kozłowskia, Janusz Sosnowskia
(aInstitute of Computer Science, Warsaw University of Technology, ul. Nowowiejska 15/18, Warsaw 00-665, Poland)
Abstract
Fast growing market related to Internet of Things creates new demands for wireless sensor networks. Here we face the problem of optimizing energy consumption in many miniature electronic devices powered from local batteries and requested long life span of nodes up to 5-10 years. The transmission processes constitute the primary source of energy consumption in the node, however complex data processing can also contribute a non negligible component. Optimizing energy consumption we can use various energy saving schemes, e.g. bringing the nodes in a sleeping mode and waking them periodically. In the paper we analyse in detail time and power components influencing energy consumption profiles. The derived original parameters are helpful to create power consumption models for specific applications. The presented methodology has been verified experimentally within (TI) CC1310F128 chip.
Keywords
IoT, energy consumption, wireless sensor networks, software defined network
1. Introduction
Wireless sensor networks (WSNs) are used in many domains related to industry, infrastructure protection, civil and military monitoring, scientific explorations, etc. Typically, the used WSN nodes are powered from batteries with limited energy. Hence, an important issue is to assure long lifetime of the network. This problem has been discussed in recent literature 1 2 3 4 5 6, where various techniques saving energy consumption have been proposed. The general idea is to optimize the use of power saving modes in the nodes. The prevailing mechanism allowing to reduce energy consumption is duty-cycling. In this technique the node sleeps most of the time and wakes up only at selected moments to extend the lifespan of nodes up to 5-10 years. Unfortunately, the scheduled duty-cycling technique is always a trade-off between energy consumption and delay in delivering the data frame to the target node. Another technique that does not have this problem is employing an additional wake-up radio, but it increases costs.
In the literature various solutions of power saving have been proposed assuming some simplified operational models or targeted at specific problems, e.g. optimization of total energy usage in the network in relevance to minimal delays, optimization of routing protocols (short hop vs long hop 7), network coverage 8. We have found that an important issue is to investigate power usage profiles in relevance to activity of node resources (namely those related to data processing, memories and radio communication) and possible operational modes. This problem is neglected in the literature. We have developed an original methodology of experimental characterization of power usage profiles which bases on deriving several parameters. These parameters are helpful to create operational power usage models for target applications. They are targeted at the framework of the duty-cycling mechanism. In the performed experiments we focus on radio communication issue taking into account output power programming and the impact of node synchronization. Moreover, we analyse impact of transmission formats as well as the time needed for transitions into sleeping mode and waking time (for different software schemes). This is followed by tracing power usage for several typical scenarios (including a command chain). This study is illustrated with results obtained for quite sophisticated Texas Instruments (TI) CC1310F128 chip. For this purpose a special software has been developed.
Section 2 specifies the WSN node as well as the software used in our analysis. We refer to the example of commercially available chip. Section 3 gives an outline of power saving problems and presents an original methodology of characterizing power usage features in network nodes. It is illustrated with various measurement results of the tested node within a specific environment. Section 4 presents the proposed energy consumption model. Research conclusions are summarized in section 5.
2. WSN node specification
Analysing energy consumption of WSN nodes we have decided to refer it to real commercial circuits. In our research we uses TI CC1310 chip which can be considered as a typical and representative WSN node. Energy consumption measurements were made in several scenarios that are characteristic when transceiver is working in WSN. The measurements were taken for the Texas Instruments (TI) CC1310F128 chip. The CC1310 chip is a member of the CC26xx and CC13xx family of ultra-low-power, 2.4-GHz and Sub-1 GHz RF devices. Very low active RF and microcontroller (MCU) current consumption, in addition to low-power modes, provide extended battery lifetime and allow long-range operation in energy-harvesting applications. The CC1310 device combines very low power RF transceiver with a 48-MHz Cortex®-M3 microcontroller in a platform supporting multiple physical layers and RF standards. A dedicated Radio Controller (Cortex®-M0) (RF core) handles low-level RF protocol commands that are stored in ROM or RAM. The tested chip was a part of the LAUNCHXL-CC1310 development board (Rev: 1.4.1). The measurement of energy consumption was made as a measurement of voltage drop on a precision 1 ohm resistor placed in the power supply circuit of the CC1310 chip. Voltage drop measurement as a function of time was made using a digital oscilloscope equipped with high impedance and low capacity measuring probes. The CC1310 chip was powered with constant voltage of 3.3V.
To minimize power consumption, the CC1310 supports a number of power modes and power-management features, see Table 1. For each power mode we specify the availability of CPU, Flash and SRAM memories, Radio and clock circuitry (HF – high frequency, LF – low frequency). For ACTIVE and IDLE mode all interrupts are available, there are 34 interrupts in the vector table. In STANDBY mode, only the always-on (AON) domain is active. An external wake-up event, Real time clock (RTC) interrupt, or Sensor Controller event is required to return the device to active mode. In SHUTDOWN mode, the device is entirely turned off, and interrupts can be generated only by Reset and enabled pins.
Table 1. Power modes of CC1310 device.
|
Mode |
CPU |
Flash |
SRAM |
Radio |
Clock |
Current (without radio) |
Interrupts |
|
ACTIVE |
On |
On |
On |
Available |
HF + LF |
1,2 mA + 25,5 μA/MHz |
Available |
|
IDLE |
Off |
Available |
On |
Available |
HF + LF |
570 μA |
Available |
|
STANDBY |
Off |
Off |
On |
Off |
LF |
0,8 μA |
Available |
|
SHUTDOWN |
Off |
Off |
Off |
Off |
Off |
185 nA |
Reset and PIN only |
The software created to implement the measurement scenarios uses the Power Policy mechanism to reduce energy consumption. The purpose of the Power Policy is to make a decision regarding power savings when the CPU is idle. CPU is considered idle when the operating system’s Idle loop is executed, when all application threads are blocked waiting for I/O operations, or blocked waiting for some other application events. All measurements were made using the aggressive Power_standbyPolicy() policy version included in the TI drivers collection. This strategy forces the unit to transit to STANDBY mode whenever possible. Transiting to STANDBY mode is not possible if the RF unit is running or when the time to the next scheduled task is too short, in such cases the device automatically switches to IDLE mode.
The CC1310 provides low leakage on-chip SRAM with optional retention in all power modes. Retention can be configured per block, and the chip contains two blocks of 6KB and two blocks of 4KB. Although retention can be configured in blocks, this will not give any noticeable reduction of current consumption. All measurement scenarios assume the retention of the whole RAM, because in real conditions 20kB will be used entirely.
The STANDBY is the power mode between the Wait for Interrupt (WFI) instruction and the interrupt from Real time clock (RTC) used to wake-up a device. The average current in the STANDBY mode is 600nA, when the internal RC oscillator is used and 800nA if an external crystal oscillator is used. The recharge is a mandatory function during STANDBY in order to retain RAM and ensure power for running clocks. The energy consumption between these recharges is around 70 nA, according to SWRA478C9 Application Report. The recharge current is not fixed as the recharge pulses are dynamically adapted based on the required time in STANDBY. For shorter STANDBY periods than 1s the average current is slightly higher then stated in datasheet.
The RF core interfaces the analog RF and baseband circuitries, handles data to and from the system side, and assembles the information bits in a given packet structure. The RF core offers a high-level, command-based application program interface (API) to the system MCU and autonomously handles the time-critical radio activities. The RF core has sets of predefined IEEE 802.15.4 specific commands as well supports so called proprietary mode. In the developed software we used proprietary mode which gives high flexibility to create own frame structure and command chaining mechanism. Table 2 lists the RF commands that we employ, along with a brief description.
Table 2. List of RF commands employed in tested scenarios.
|
Command name |
Command ID |
Description |
|
CMD_PROP_RADIO_DIV_SETUP |
0x3807 |
Set up radio in proprietary mode |
|
CMD_FS |
0x0803 |
Frequency Synthesizer Controls Command |
|
CMD_SET_TX_POWER |
0x0010 |
Set Transmit Power |
|
CMD_PROP_TX_ADV |
0x3803 |
Transmit packet with advanced modes |
|
CMD_PROP_RX_ADV |
0x3804 |
Receive frame or frames with advanced modes |
The developed software uses the real-time operating system (RTOS) provided by TI called TI-RTOS Kernel along with TI drivers, a collection of low-level drivers that provide abstracted, functional access to peripherals. The TI-RTOS Kernel uses the concept of microkernal therefore provides minimum OS functionality which can be further expanded using modules and drivers. TI-RTOS is a part of the official software development kit (SDK) provided by TI. We use the following drivers to extend core functionality and gain access to required peripherals:
-
<ti/drivers/rf/RF.h> – The RF driver provides access to the radio core on the CC13xx/CC26xx device family.
-
<ti/drivers/power/PowerCC26XX.h> – Power manager interface for CC26XX/CC13XX
-
<ti/drivers/pin/PINCC26XX.h> – Device-specific pin & GPIO driver for CC26xx family
Moreover, in one scenario we use the “bare-metal” application to compare the transition time when waking-up the device. The “bare-metal” application uses the NoRTOS framework provided by TI (NoRTOS.h) and relies on the same drivers collection, therefore we consider it gives results that can be compared.
3. Power profiling experiments
Depending upon the network application domain various operational and transmission schemes can be used. Moreover, some adaptive features can be included as well as diverse protocols for horizontal and vertical communication. In the process of evaluation and optimization of the node and network power consumption an important issue is to find appropriate characteristic parameters. We have identified such parameters which describe the following node activities:
• Wake-up (transition from STANDBY to ACTIVE state)
• Going to deep –sleep (transition from ACTIVE to STANDBY state)
• Receiving and transmitting data
• Changing power level and frequency of the transmitter
• Node synchronization
The relevant power consumption and duration of these activities have been derived using a special program loaded into the considered node (section 2). This program assures collecting appropriate data from the testbed (power time plots) for the further analysis.
Wake-up from deep sleep
WSN nodes periodically wake up from a deep sleep so that they can establish communication with each other. The wake-up procedure is triggered by an interrupt from the RTC clock, which also works during deep sleep. The CC1310 has RTC clocked from an additional, always on, low frequency oscillator (LF). The LF oscillator can use internal RC circuit or external crystal for higher accuracy.
The STANDBY mode has the lowest power consumption and supports the RTC interrupt that is necessary to wake up the device. Therefore, the WSN node will be in STANDBY mode for most of the time, from which it will be woken up periodically to ACTIVE mode. The IDLE mode can be used to reduce energy consumption while listening to upcoming transmission. The power consumption during the STANDBY → ACTIVE wake-up procedure and the immediate transition back to deep sleep mode is shown in Figure 1.
The measurements were made for the application under the control of TI-RTOS and as a „bare-metal” application. Both applications use the same set of TI drivers, described in the previous chapter.
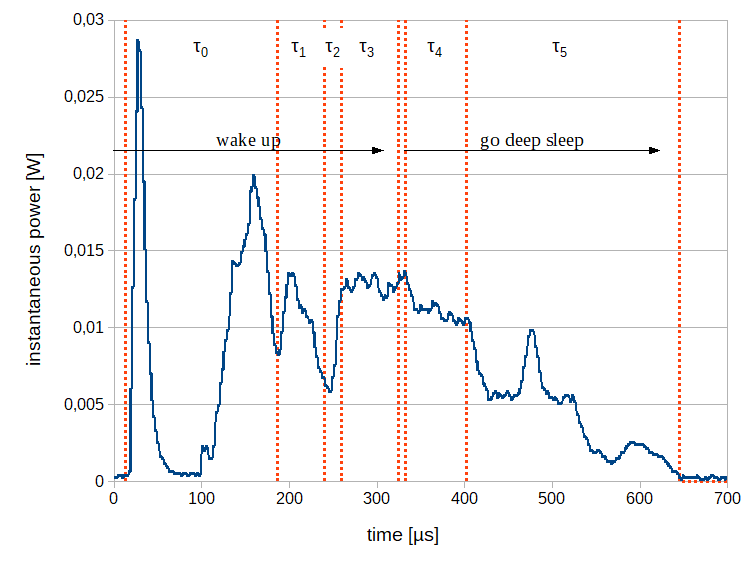
Figure 1. The power consumption during the STANDBY → ACTIVE → STANDBY procedure for “bare-metal” (left) and TI‑RTOS (right) based applications.
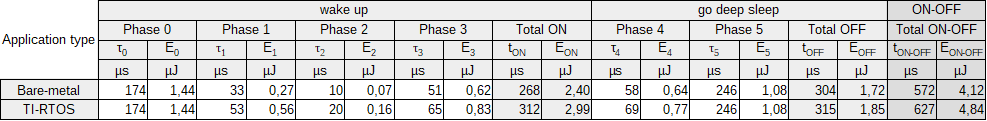
The duration and relevant energy consumption of each phase are presented in Table 3. Moreover, for “wake-up” and “go deep sleep” actions we give summarized time and energy values specified as tON, EON, and tOFF and EOFF, respectively. In addition, these values are summarized in the last column “ON-OFF”. The energy consumption has been calculated from Figure 1 by numerical integration based on a trapezoidal rule with a sampling period – 1μs.
Table 3. The energy measurements for the STANDBY → ACTIVE → STANDBY procedure.
Several phases of wake-up and go deep sleep procedures can be distinguished. Phase 0 ends when returning from Wait for Interrupt (WFI) instruction. The length of this phase is only hardware dependent. Phases 1,2 and 3 compose software power-up procedure after which program go back to the main routine, while phases 4 and 5 form a deep sleep transition procedure that eventually ends with a WFI instruction. The individual phases are identified using the notification mechanism available in the PowerCC26XX.h driver. This notification mechanism relies on callback functions, which are called from the context where the Power API was invoked for initiating a particular transitions between power modes. Notifications are registered using the Power_registerNotify() API function. The completion of phases 1 and 2 is determined by events PowerCC26XX_AWAKE_STANDBY and PowerCC26XX_AWAKE_STANDBY_LATE respectively. The second power event is sent later during wakeup, after interrupts are re-enabled. During go deep sleep procedure the PowerCC26XX_ENTERING_STANDBY event ends phase 4. The complete power-up sequence can be found in the TI reference guide10.
Receiving and transmitting frames
Receiving and transmitting after waking up from STANDBY requires a power-up radio procedure. By default, the RF driver measures the time that it needs for the power-up procedure and uses that as an estimation for the next power cycle. On the CC13xx, power-up radio and wake-up from STANDBY takes usually about 1.6 ms in total (phase0 + phase1). Automatic measurement can be suppressed by specifying a custom power-up time. In addition, phase 3 is inserted to cover any uncertainty when doing automatic measurements. This is necessary especially in applications with a high hardware interrupt load which can delay the RF driver’s internal state machine execution. The power consumption during receiving and transmitting frame is shown in Figure 2.
Certain phases are identified using RF core interrupts. The RF core has four interrupt lines to MCU which are mapped to system events. The end of phase 2 was determined based on the RF_EventPowerUp event. The RF_EventCmdDone event allowed to determine the end of phase 5. The duration and relevant energy consumption of each phase are presented in Table 4. In addition, a brief description of each phase is given, and the total time and energy is presented in the last column. The phase 4’ is specific to the receiving mode, in this phase proper transmission from the transmitter has not started yet, and the node is idle listening to the transmission channel. In practical applications, the duration of phase 4’ varies and depends on the MAC protocol itself, as well as on the accuracy of the clocks in the nodes.
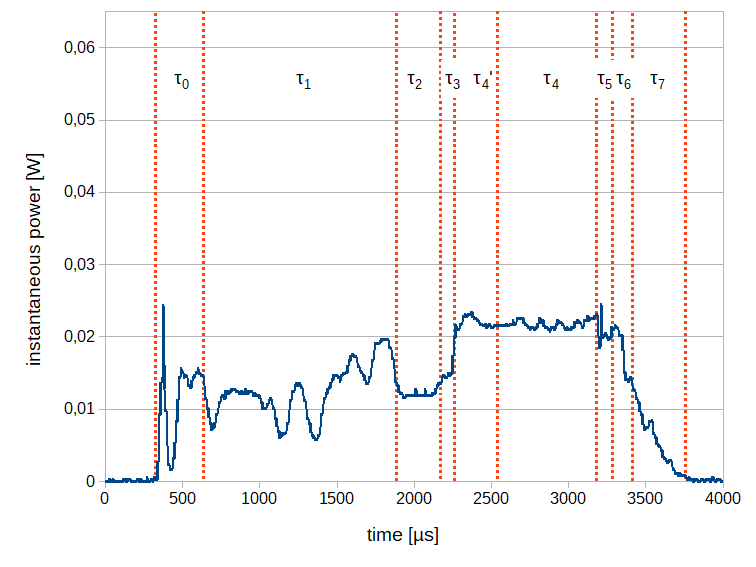

Figure 2. The power consumption during the receiving (left) and transmitting (right) a 32B long frame.
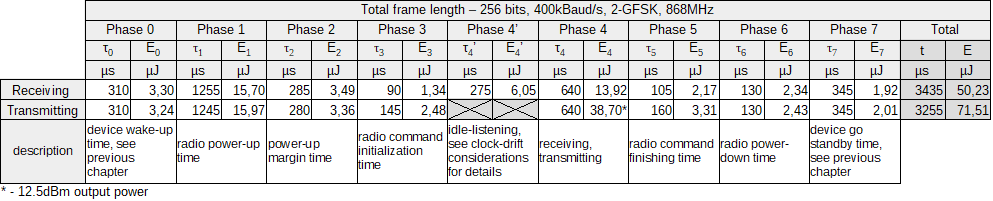
Table 4. The energy measurements for receiving and transmitting a 32B long frame.
Based on the results of measurements, we introduce the following constants/variables for later use:
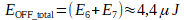
- The total power-up energy consumption

- The total energy consumption when going to STANDBY mode
- The energy consumption when receiving
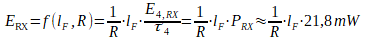 and transmitting
  where
where  is a total frame length in bits and
  is a bit rate in bits per second.
 - The idle-listening energy consumption
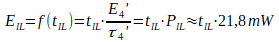 where
where  is an idle-listening time. In this regard, it has to be noted that
- The energy consumption during the initialization of the radio command
 and the energy consumption when completing the radio command for receiving
 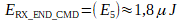 and transmitting
Command chaining
The radio commands are carried out consecutively. The best examples of sequences are: sending multiple frames, the Listen Before Talk (LBT) procedure, or waiting for acknowledgement after frame transmission (ACK). The power consumption measurements for the transition in different sequences are presented in Figure 3 (TX→TX, TX→RX) and 4 (RX→TX, RX→RX). The MCU can schedule RF commands by using the next operation pointer in any radio operation command. This pointer can point to the next command to be performed in the chain, therefore, complex sequences can be executed without MCU involvement.
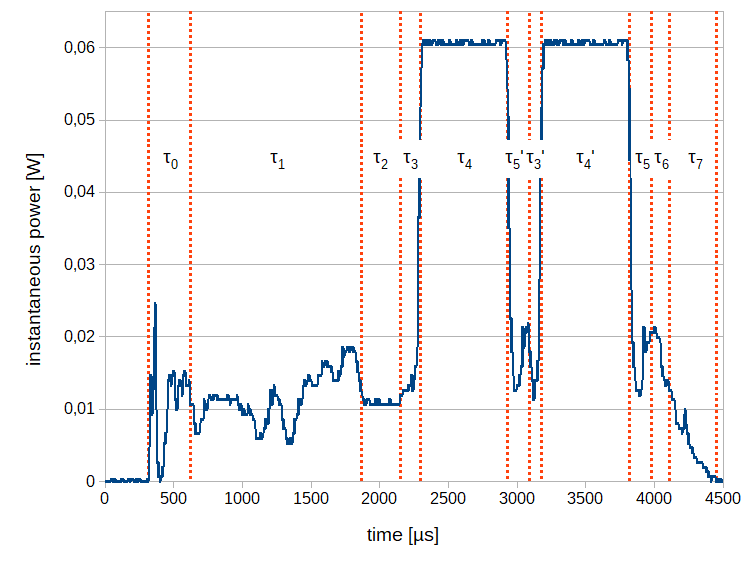
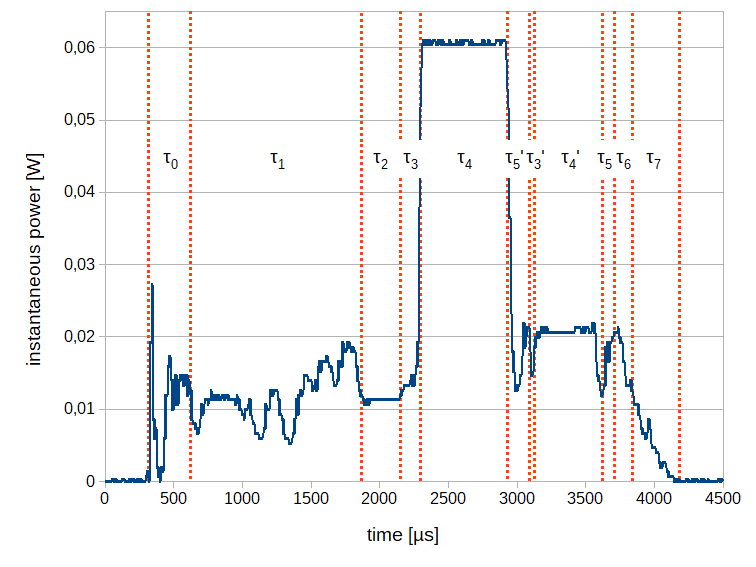
Figure 3. The power consumption during sequence of operations for TX→TX (left) and TX→RX (right).
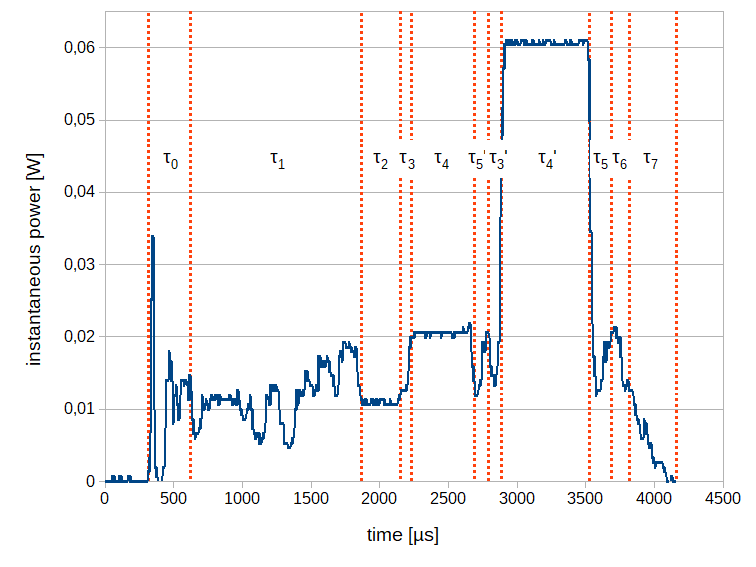
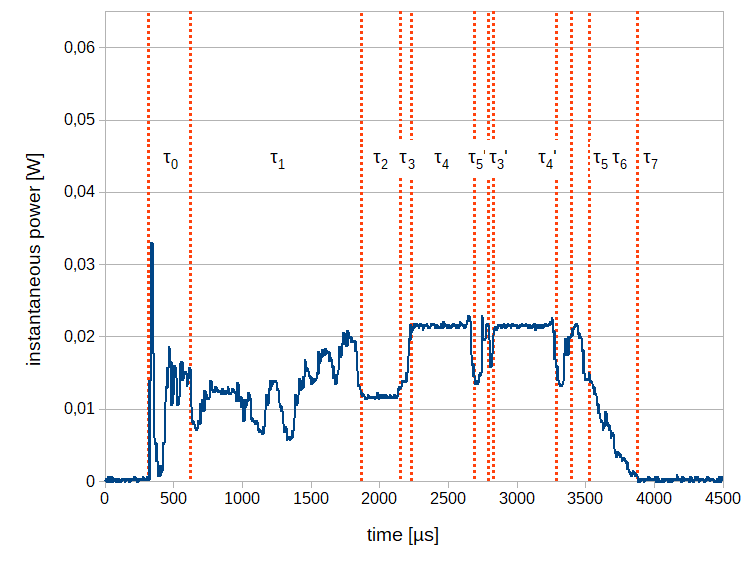
Figure 4. The power consumption during sequence of operations for RX→TX (left) and RX→RX (right).
Table 5. The energy consumption measurements for sequence of operations: TX→TX, TX→RX, RX→TX, RX→RX.
The duration and relevant energy consumption of each phase are presented in Table 5. The phase numbering corresponds to specified in Table 4. The energy consumption has been calculated from Figure 3 and 4 respectively using numerical integration. The phases of the second command in the chain are additionally marked with an apostrophe.
Changing the power of the transmitter
In the previous subsections, we assumed that the transmitter works with a maximum power of 12.5dBm, while the transmitter’s power output can be changed in a wide range. Table 6 presents the measurements of energy consumption for different transmitter power output levels. The energy measurement corresponds to Phase 4 from the previous subsection, POUT is the transmitter output power expressed in dBm declared by the chip manufacturer, PTX is the instantaneous power measured during Phase 4 according to the previous section.
Table 6. The energy consumption measurements for transmitting with different power output levels.

Hence, ETX can be expressed in more general way:![]() where
where ![]()
Changing the output power of the transmitter for the next frame does not require noticeable time and energy, because the required txPower parameter is stored and applied every time transmission of a frame starts to set an output power including temperature compensation coefficient. The transmit power level setting is carried out by the main core independently of the RF core by invoking CMD_SET_TX_POWER command using RF_runImmediateCmd() method which takes about 15μs on the MCU.
Changing the frequency/channel
Practical WSN applications use frequency hopping (FHSS) to spread signal over wide range of frequencies and to reduce interference with coexistent wireless technologies11. The FHSS is a method of switching a carrier among many frequency channels, using sequence known to both transmitter and receiver. The FHSS is widely used in the present standards, e.g. Bluetooth or IEEE 802.15.4e as a part of Time Slotted Channel Hopping12 (TSCH) – channel multiple access method. Therefore, changing the carrier frequency during frame sequences is necessary. The synthesizer frequency can be changed using CMD_FS radio operation command. Frequency calibration is performed during every CMD_FS command invocation. The measured energy consumption and duration are as follows: ![]() .
.
![]()
Nodes synchronization
The basic mechanism used to synchronize nodes in a synchronous duty-cycling technique is the broadcasting of special frames. Figure 5 presents the beacon frame format for the IEEE 802.15.4 standard. General PHY and MAC frame format of IEEE 802.15.4 can be found in 13. Measurements for the IEEE 802.15.4 standard were made for the SUN 2-FSK physical layer. The frame consisted of: SHR – 6 octets (4 octets – preamble, 2 octets – synchronization word), PHR – 2 octets, MHR – 12 octets (4 octets – addressing, 5 octets – security, known key), MSDU – 10 octets (8 octets – MIC:CCM-8), MFR – 2 octets.
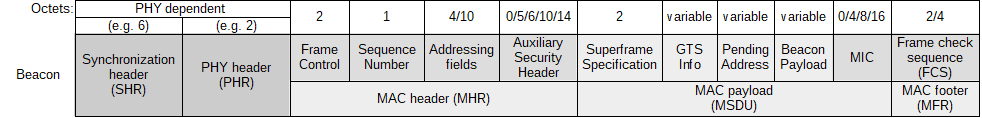
Figure 5. The IEEE 802.15.4 beacon frame format.
Table 7. The CC1310 energy consumption while receiving and transmitting beacon for different bit rates.

Table 7 presents the energy consumption measurements for sending and receiving a beacon frame at different bit rates. It is worth noting that the amount of energy needed to receive the beacon at 400kBaud/s bit rate is only 3 times lower than at 8 times lower bit rate.
4. ENERGY MODEL
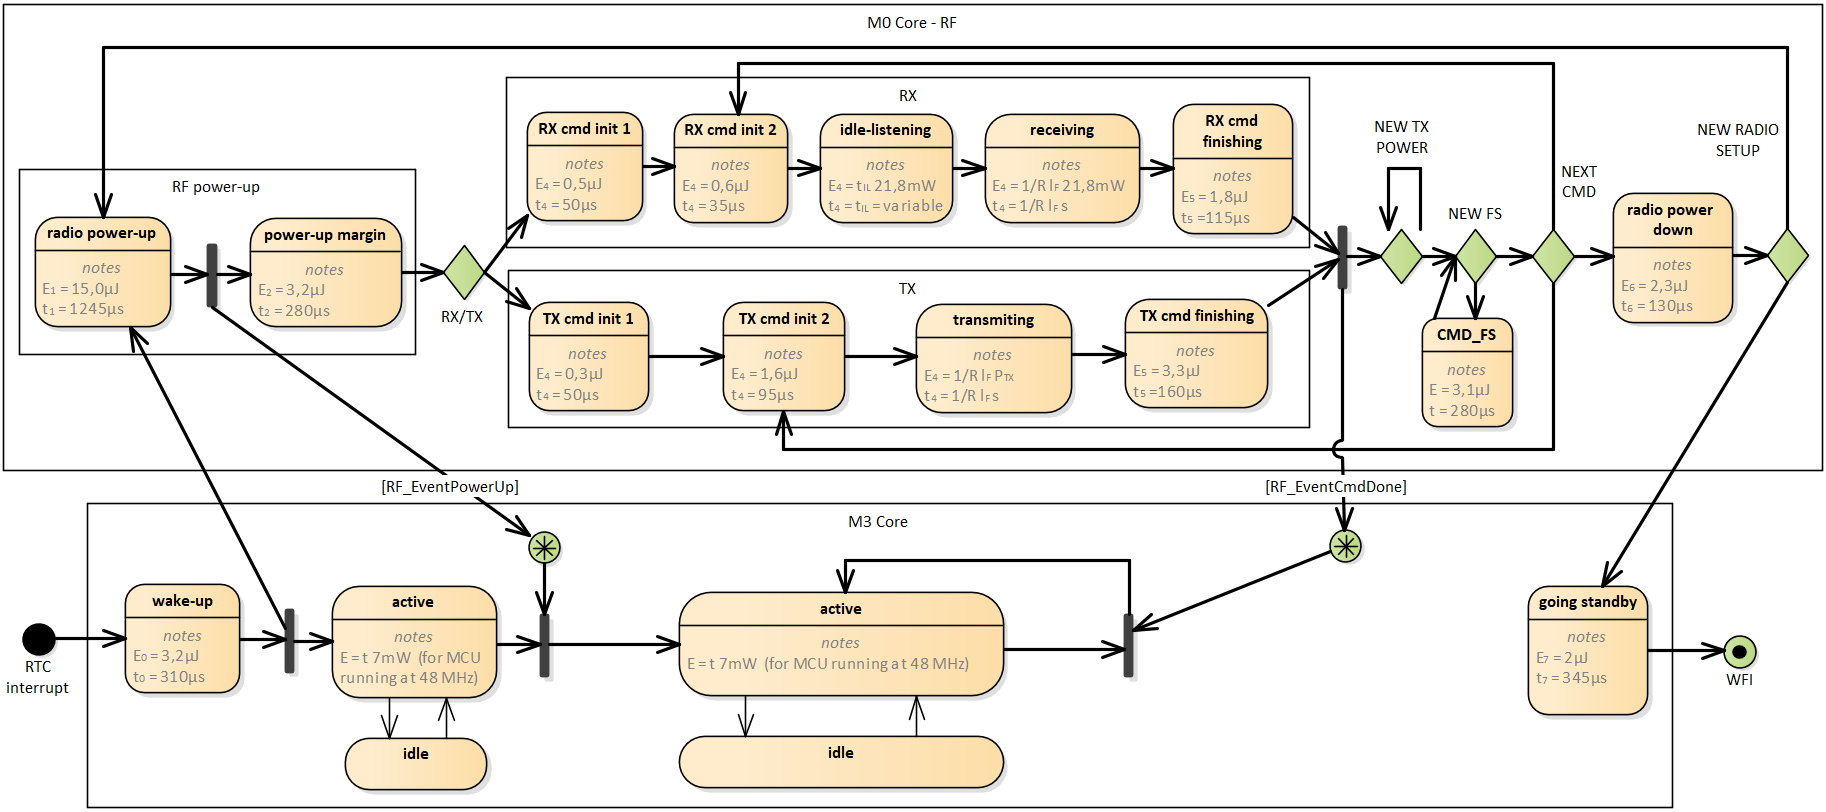
Figure 6. State diagram for the CC1310 energy model.
Based on the measurements, an energy model was derived. Figure 6 presents the model using the state diagram notation. States for the MCU and for the RF Core are presented separately and are enclosed in boundary with given core name. For each state, self-explanatory name was given along with energy consumption and time spent in this state. In some states, such as receiving or transmitting, the duration of the state and energy consumption are not fixed and depend on certain parameters, therefore the appropriate equations for their calculation are given. Five points of choice are considered for: RX/TX mode, setting new power output, setting new RF frequency, processing new radio command and finally to re-setup the whole RF unit. Between the WFI instruction and the RTC interrupt, the device is in STANDBY mode, where the energy consumption is approximately 2,9μW, according to the datasheet. In the model, we assume that immediately after waking up, the RF unit is turned on and remains active till the new duty cycle. On the other hand, the MCU may be turned off in case of its inactivity in accordance with power policy. MCU can transit between ACTIVE and IDLE states, the transition time is relatively short and equal to 14μs. It is worth noting that, especially at lower bitrates, MCU has an excess of computing power when compared to the time necessary to process RF commands, therefore MCU is considered to spend most of the time in deep sleep, saving energy. The total time spent on processing tasks in MCU is 150μs for the tested scenarios. This time was determined using the TI-RTOS Analyser included in the official SDK. The MCU spends the remaining time in deep sleep, idle mode (570uA, VDDS=3,6V). In the testing scenarios we do not perform any data processing or other operations related to the real stack implementation, therefore we can assume this time as minimum value required by TI-RTOS itself. Practical applications will execute complex and time consuming operations on the MCU therefore, energy required for task processing in the MCU (EMCU) should be considered. Based on these assumptions, the EMCU can be derived as the difference between the energy consumption in the active and the idle modes, and therefore can be expressed as:
![]() where
where ![]() is total time spent in active mode,
is total time spent in active mode, ![]() is clock speed in MHz,
is clock speed in MHz,![]() is supply voltage with DC-DC enabled. Thanks to DC-DC converter and assuming 48MHz clock speed
is supply voltage with DC-DC enabled. Thanks to DC-DC converter and assuming 48MHz clock speed ![]()
The RF Power-up states include performing all necessary settings of the RF unit, such as CMD_PROP_RADIO_DIV_SETUP and CMD_FS commands. The power-up time margin can be adjusted to certain application and environmental conditions. Synchronization between cores uses events mechanism and two of them are depicted on the state diagram RF_eventPowerUp and RF_eventCmdDone.
5. CONCLUSION
The presented methodology of deriving power consumption profiles of WSN nodes can be efficiently implemented within a simple testbed comprising appropriate software. The derived parameters assure higher accuracy in evaluation and optimization of the life span of nodes and the network in relation to various operational transmission schemes.
We found that the TI-RTOS overhead when compared to „bare-metal” application during the STANDBY → ACTIVE → STANDBY procedure is relatively small and equal to 10% in terms of time and 17% in terms of energy. The power-up radio procedure takes a lot of time and consumes a relatively large amount of energy that equals roughly to 18μJ, which is the equivalent of receiving a 42B frame at 400kBaud/s bitrate. Therefore, the node must be awoken about 1,9ms earlier than the scheduled time of transmission rendezvous. The used power save policies have to be aware of the total transition time, which is 2.3ms, when RF unit is taken into account. The CC1310 chip architecture, which uses 2 independent cores is extremely efficient and along with the possibility to completely turn off MCU, allows to save energy when processing RF commands. Storing the RF unit program along with its API in the special ROM memory is cost-effective but it does not allow for effective fixing bugs and further enhancement. When designing energy-aware MAC protocols, you need to consider the time necessary to transit between RX and TX modes. The time is not negligible and ranges from 140μs (RX→RX) to 250μs (TX→TX) depending on the transition sequence, whilst the energy ranges from 2.4μJ to 5,2μJ respectively. Changing the output power of a transmitter can lead to significant energy savings, transmission with minimum output power (-10dBm) consumes 2.7 times less energy than at maximum output power (12,5dBm). Moreover the output power can be easily changed before every frame and the energy needed to proceed this change is negligible. The frequency hopping mechanism is considered effective and energy to alter frequency is equal to 3,1μJ, which is the equivalent of receiving only a 7B frame at 400kBaud/s bitrate.
Further research is planned to use energy consumption parameters for developing self-adapting networks.
REFERENCES
[1] Liu, F., Wang, Y., Lin, M., Liu, K. and Wu, D., “A Distributed Routing Algorithm for Data Collection in Low-Duty-Cycle Wireless Sensor Networks,” IEEE Internet Things J. 4(5), 1420–1433 (2017).
[2] Li, F. and Wang, L., “Energy-aware routing algorithm for wireless sensor networks with optimal relay detecting,” Wirel. Pers. Commun. 98(2), 1701–1717 (2018).
[3] Wu, H., Zhang, L. and Miao, Y., “The Propagation Characteristics of Radio Frequency Signals for Wireless Sensor Networks in Large-Scale Farmland Las características de propagación de las señales de radiofrecuencia para redes de sensores inalámbricos en granjas de gran escala,” Wirel. Pers. Commun. 95(4), 3653–3670 (2017).
[4] Duan, J., Gao, D., Yang, D., Foh, C. H. and Chen, H. H., “An energy-aware trust derivation scheme with game theoretic approach in wireless sensor networks for IoT applications,” IEEE Internet Things J. 1(1), 58–69 (2014).
[5] Mafirabadza, C. and Khatri, P., “Efficient Power Aware AODV Routing Protocol for MANET,” Wirel. Pers. Commun. 97(4), 5707–5717 (2017).
[6] Rani, S., Ahmed, S. H., Talwar, R., Malhotra, J. and Song, H., “IoMT: A Reliable Cross Layer Protocol for Internet of Multimedia Things,” IEEE Internet Things J. 4(3), 832–839 (2017).
[7] Fedor, S. and Collier, M., “On the problem of energy efficiency of multi-hop vs one-hop routing in Wireless Sensor Networks,” Proc. – 21st Int. Conf. Adv. Inf. Netw. Appl. Work. AINAW’07 1, 380–385 (2007).
[8] More, A. and Raisinghani, V., “A node failure and battery-aware coverage protocol for wireless sensor networks,” Comput. Electr. Eng. 64, 200–219 (2017).
[9] Lee, C., Lindh, J. and Hernes, M., “Measuring Bluetooth® Low Energy Power Consumption,” Texas Instruments(2017), 1–24 (2015).
[10] “CC26x0, CC13x0 SimpleLinkTM Wireless MCU Power Management Software Development Reference Guide.”, (2017).
[11] Zoppi, S., Gürsu, H. M., Vilgelm, M. and Kellerer, W., “Reliable hopping sequence design for highly interfered wireless sensor networks,” IEEE Work. Local Metrop. Area Networks 2017–June, 0–6 (2017).
[12] Du, P. and Roussos, G., “Adaptive time slotted channel hopping for wireless sensor networks,” 2012 4th Comput. Sci. Electron. Eng. Conf. CEEC 2012 – Conf. Proc., 29–34 (2012).
[13] Kozłowski, A. and Sosnowski, J., “Analysing efficiency of IPv6 packet transmission over 6LoWPAN network,” Proc. SPIE, Photonics Appl. Astron. Commun. Ind. High Energy Phys. Exp. 10445, 104451J (2017).
Publikacje naukowe
Adam Kozłowskia, Janusz Sosnowskia
(aInstitute of Computer Science, Warsaw University of Technology, ul. Nowowiejska 15/18, Warsaw 00-665, Poland)
Abstract
Fast growing market related to Internet of Things creates new demands for wireless sensor networks. Here we face the problem of optimizing energy consumption in many miniature electronic devices powered from local batteries and requested long life span of nodes up to 5-10 years. The transmission processes constitute the primary source of energy consumption in the node, however complex data processing can also contribute a non negligible component. Optimizing energy consumption we can use various energy saving schemes, e.g. bringing the nodes in a sleeping mode and waking them periodically. In the paper we analyse in detail time and power components influencing energy consumption profiles. The derived original parameters are helpful to create power consumption models for specific applications. The presented methodology has been verified experimentally within (TI) CC1310F128 chip.
Keywords
IoT, energy consumption, wireless sensor networks, software defined network
1. Introduction
Wireless sensor networks (WSNs) are used in many domains related to industry, infrastructure protection, civil and military monitoring, scientific explorations, etc. Typically, the used WSN nodes are powered from batteries with limited energy. Hence, an important issue is to assure long lifetime of the network. This problem has been discussed in recent literature 1 2 3 4 5 6, where various techniques saving energy consumption have been proposed. The general idea is to optimize the use of power saving modes in the nodes. The prevailing mechanism allowing to reduce energy consumption is duty-cycling. In this technique the node sleeps most of the time and wakes up only at selected moments to extend the lifespan of nodes up to 5-10 years. Unfortunately, the scheduled duty-cycling technique is always a trade-off between energy consumption and delay in delivering the data frame to the target node. Another technique that does not have this problem is employing an additional wake-up radio, but it increases costs.
In the literature various solutions of power saving have been proposed assuming some simplified operational models or targeted at specific problems, e.g. optimization of total energy usage in the network in relevance to minimal delays, optimization of routing protocols (short hop vs long hop 7), network coverage 8. We have found that an important issue is to investigate power usage profiles in relevance to activity of node resources (namely those related to data processing, memories and radio communication) and possible operational modes. This problem is neglected in the literature. We have developed an original methodology of experimental characterization of power usage profiles which bases on deriving several parameters. These parameters are helpful to create operational power usage models for target applications. They are targeted at the framework of the duty-cycling mechanism. In the performed experiments we focus on radio communication issue taking into account output power programming and the impact of node synchronization. Moreover, we analyse impact of transmission formats as well as the time needed for transitions into sleeping mode and waking time (for different software schemes). This is followed by tracing power usage for several typical scenarios (including a command chain). This study is illustrated with results obtained for quite sophisticated Texas Instruments (TI) CC1310F128 chip. For this purpose a special software has been developed.
Section 2 specifies the WSN node as well as the software used in our analysis. We refer to the example of commercially available chip. Section 3 gives an outline of power saving problems and presents an original methodology of characterizing power usage features in network nodes. It is illustrated with various measurement results of the tested node within a specific environment. Section 4 presents the proposed energy consumption model. Research conclusions are summarized in section 5.
2. WSN node specification
Analysing energy consumption of WSN nodes we have decided to refer it to real commercial circuits. In our research we uses TI CC1310 chip which can be considered as a typical and representative WSN node. Energy consumption measurements were made in several scenarios that are characteristic when transceiver is working in WSN. The measurements were taken for the Texas Instruments (TI) CC1310F128 chip. The CC1310 chip is a member of the CC26xx and CC13xx family of ultra-low-power, 2.4-GHz and Sub-1 GHz RF devices. Very low active RF and microcontroller (MCU) current consumption, in addition to low-power modes, provide extended battery lifetime and allow long-range operation in energy-harvesting applications. The CC1310 device combines very low power RF transceiver with a 48-MHz Cortex®-M3 microcontroller in a platform supporting multiple physical layers and RF standards. A dedicated Radio Controller (Cortex®-M0) (RF core) handles low-level RF protocol commands that are stored in ROM or RAM. The tested chip was a part of the LAUNCHXL-CC1310 development board (Rev: 1.4.1). The measurement of energy consumption was made as a measurement of voltage drop on a precision 1 ohm resistor placed in the power supply circuit of the CC1310 chip. Voltage drop measurement as a function of time was made using a digital oscilloscope equipped with high impedance and low capacity measuring probes. The CC1310 chip was powered with constant voltage of 3.3V.
To minimize power consumption, the CC1310 supports a number of power modes and power-management features, see Table 1. For each power mode we specify the availability of CPU, Flash and SRAM memories, Radio and clock circuitry (HF – high frequency, LF – low frequency). For ACTIVE and IDLE mode all interrupts are available, there are 34 interrupts in the vector table. In STANDBY mode, only the always-on (AON) domain is active. An external wake-up event, Real time clock (RTC) interrupt, or Sensor Controller event is required to return the device to active mode. In SHUTDOWN mode, the device is entirely turned off, and interrupts can be generated only by Reset and enabled pins.
Table 1. Power modes of CC1310 device.
|
Mode |
CPU |
Flash |
SRAM |
Radio |
Clock |
Current (without radio) |
Interrupts |
|
ACTIVE |
On |
On |
On |
Available |
HF + LF |
1,2 mA + 25,5 μA/MHz |
Available |
|
IDLE |
Off |
Available |
On |
Available |
HF + LF |
570 μA |
Available |
|
STANDBY |
Off |
Off |
On |
Off |
LF |
0,8 μA |
Available |
|
SHUTDOWN |
Off |
Off |
Off |
Off |
Off |
185 nA |
Reset and PIN only |
The software created to implement the measurement scenarios uses the Power Policy mechanism to reduce energy consumption. The purpose of the Power Policy is to make a decision regarding power savings when the CPU is idle. CPU is considered idle when the operating system’s Idle loop is executed, when all application threads are blocked waiting for I/O operations, or blocked waiting for some other application events. All measurements were made using the aggressive Power_standbyPolicy() policy version included in the TI drivers collection. This strategy forces the unit to transit to STANDBY mode whenever possible. Transiting to STANDBY mode is not possible if the RF unit is running or when the time to the next scheduled task is too short, in such cases the device automatically switches to IDLE mode.
The CC1310 provides low leakage on-chip SRAM with optional retention in all power modes. Retention can be configured per block, and the chip contains two blocks of 6KB and two blocks of 4KB. Although retention can be configured in blocks, this will not give any noticeable reduction of current consumption. All measurement scenarios assume the retention of the whole RAM, because in real conditions 20kB will be used entirely.
The STANDBY is the power mode between the Wait for Interrupt (WFI) instruction and the interrupt from Real time clock (RTC) used to wake-up a device. The average current in the STANDBY mode is 600nA, when the internal RC oscillator is used and 800nA if an external crystal oscillator is used. The recharge is a mandatory function during STANDBY in order to retain RAM and ensure power for running clocks. The energy consumption between these recharges is around 70 nA, according to SWRA478C9 Application Report. The recharge current is not fixed as the recharge pulses are dynamically adapted based on the required time in STANDBY. For shorter STANDBY periods than 1s the average current is slightly higher then stated in datasheet.
The RF core interfaces the analog RF and baseband circuitries, handles data to and from the system side, and assembles the information bits in a given packet structure. The RF core offers a high-level, command-based application program interface (API) to the system MCU and autonomously handles the time-critical radio activities. The RF core has sets of predefined IEEE 802.15.4 specific commands as well supports so called proprietary mode. In the developed software we used proprietary mode which gives high flexibility to create own frame structure and command chaining mechanism. Table 2 lists the RF commands that we employ, along with a brief description.
Table 2. List of RF commands employed in tested scenarios.
|
Command name |
Command ID |
Description |
|
CMD_PROP_RADIO_DIV_SETUP |
0x3807 |
Set up radio in proprietary mode |
|
CMD_FS |
0x0803 |
Frequency Synthesizer Controls Command |
|
CMD_SET_TX_POWER |
0x0010 |
Set Transmit Power |
|
CMD_PROP_TX_ADV |
0x3803 |
Transmit packet with advanced modes |
|
CMD_PROP_RX_ADV |
0x3804 |
Receive frame or frames with advanced modes |
The developed software uses the real-time operating system (RTOS) provided by TI called TI-RTOS Kernel along with TI drivers, a collection of low-level drivers that provide abstracted, functional access to peripherals. The TI-RTOS Kernel uses the concept of microkernal therefore provides minimum OS functionality which can be further expanded using modules and drivers. TI-RTOS is a part of the official software development kit (SDK) provided by TI. We use the following drivers to extend core functionality and gain access to required peripherals:
-
<ti/drivers/rf/RF.h> – The RF driver provides access to the radio core on the CC13xx/CC26xx device family.
-
<ti/drivers/power/PowerCC26XX.h> – Power manager interface for CC26XX/CC13XX
-
<ti/drivers/pin/PINCC26XX.h> – Device-specific pin & GPIO driver for CC26xx family
Moreover, in one scenario we use the “bare-metal” application to compare the transition time when waking-up the device. The “bare-metal” application uses the NoRTOS framework provided by TI (NoRTOS.h) and relies on the same drivers collection, therefore we consider it gives results that can be compared.
3. Power profiling experiments
Depending upon the network application domain various operational and transmission schemes can be used. Moreover, some adaptive features can be included as well as diverse protocols for horizontal and vertical communication. In the process of evaluation and optimization of the node and network power consumption an important issue is to find appropriate characteristic parameters. We have identified such parameters which describe the following node activities:
• Wake-up (transition from STANDBY to ACTIVE state)
• Going to deep –sleep (transition from ACTIVE to STANDBY state)
• Receiving and transmitting data
• Changing power level and frequency of the transmitter
• Node synchronization
The relevant power consumption and duration of these activities have been derived using a special program loaded into the considered node (section 2). This program assures collecting appropriate data from the testbed (power time plots) for the further analysis.
Wake-up from deep sleep
WSN nodes periodically wake up from a deep sleep so that they can establish communication with each other. The wake-up procedure is triggered by an interrupt from the RTC clock, which also works during deep sleep. The CC1310 has RTC clocked from an additional, always on, low frequency oscillator (LF). The LF oscillator can use internal RC circuit or external crystal for higher accuracy.
The STANDBY mode has the lowest power consumption and supports the RTC interrupt that is necessary to wake up the device. Therefore, the WSN node will be in STANDBY mode for most of the time, from which it will be woken up periodically to ACTIVE mode. The IDLE mode can be used to reduce energy consumption while listening to upcoming transmission. The power consumption during the STANDBY → ACTIVE wake-up procedure and the immediate transition back to deep sleep mode is shown in Figure 1.
The measurements were made for the application under the control of TI-RTOS and as a „bare-metal” application. Both applications use the same set of TI drivers, described in the previous chapter.
Figure 1. The power consumption during the STANDBY → ACTIVE → STANDBY procedure for “bare-metal” (left) and TI‑RTOS (right) based applications.
The duration and relevant energy consumption of each phase are presented in Table 3. Moreover, for “wake-up” and “go deep sleep” actions we give summarized time and energy values specified as tON, EON, and tOFF and EOFF, respectively. In addition, these values are summarized in the last column “ON-OFF”. The energy consumption has been calculated from Figure 1 by numerical integration based on a trapezoidal rule with a sampling period – 1μs.
Table 3. The energy measurements for the STANDBY → ACTIVE → STANDBY procedure.
Several phases of wake-up and go deep sleep procedures can be distinguished. Phase 0 ends when returning from Wait for Interrupt (WFI) instruction. The length of this phase is only hardware dependent. Phases 1,2 and 3 compose software power-up procedure after which program go back to the main routine, while phases 4 and 5 form a deep sleep transition procedure that eventually ends with a WFI instruction. The individual phases are identified using the notification mechanism available in the PowerCC26XX.h driver. This notification mechanism relies on callback functions, which are called from the context where the Power API was invoked for initiating a particular transitions between power modes. Notifications are registered using the Power_registerNotify() API function. The completion of phases 1 and 2 is determined by events PowerCC26XX_AWAKE_STANDBY and PowerCC26XX_AWAKE_STANDBY_LATE respectively. The second power event is sent later during wakeup, after interrupts are re-enabled. During go deep sleep procedure the PowerCC26XX_ENTERING_STANDBY event ends phase 4. The complete power-up sequence can be found in the TI reference guide10.
Receiving and transmitting frames
Receiving and transmitting after waking up from STANDBY requires a power-up radio procedure. By default, the RF driver measures the time that it needs for the power-up procedure and uses that as an estimation for the next power cycle. On the CC13xx, power-up radio and wake-up from STANDBY takes usually about 1.6 ms in total (phase0 + phase1). Automatic measurement can be suppressed by specifying a custom power-up time. In addition, phase 3 is inserted to cover any uncertainty when doing automatic measurements. This is necessary especially in applications with a high hardware interrupt load which can delay the RF driver’s internal state machine execution. The power consumption during receiving and transmitting frame is shown in Figure 2.
Certain phases are identified using RF core interrupts. The RF core has four interrupt lines to MCU which are mapped to system events. The end of phase 2 was determined based on the RF_EventPowerUp event. The RF_EventCmdDone event allowed to determine the end of phase 5. The duration and relevant energy consumption of each phase are presented in Table 4. In addition, a brief description of each phase is given, and the total time and energy is presented in the last column. The phase 4’ is specific to the receiving mode, in this phase proper transmission from the transmitter has not started yet, and the node is idle listening to the transmission channel. In practical applications, the duration of phase 4’ varies and depends on the MAC protocol itself, as well as on the accuracy of the clocks in the nodes.
Figure 2. The power consumption during the receiving (left) and transmitting (right) a 32B long frame.
Table 4. The energy measurements for receiving and transmitting a 32B long frame.
Based on the results of measurements, we introduce the following constants/variables for later use:
- The total power-up energy consumption
- The total energy consumption when going to STANDBY mode
- The energy consumption when receiving and transmitting where is a total frame length in bits and is a bit rate in bits per second.
- The idle-listening energy consumption where is an idle-listening time. In this regard, it has to be noted that
- The energy consumption during the initialization of the radio command and the energy consumption when completing the radio command for receiving and transmitting
Command chaining
The radio commands are carried out consecutively. The best examples of sequences are: sending multiple frames, the Listen Before Talk (LBT) procedure, or waiting for acknowledgement after frame transmission (ACK). The power consumption measurements for the transition in different sequences are presented in Figure 3 (TX→TX, TX→RX) and 4 (RX→TX, RX→RX). The MCU can schedule RF commands by using the next operation pointer in any radio operation command. This pointer can point to the next command to be performed in the chain, therefore, complex sequences can be executed without MCU involvement.
Figure 3. The power consumption during sequence of operations for TX→TX (left) and TX→RX (right).
Figure 4. The power consumption during sequence of operations for RX→TX (left) and RX→RX (right).
Table 5. The energy consumption measurements for sequence of operations: TX→TX, TX→RX, RX→TX, RX→RX.
The duration and relevant energy consumption of each phase are presented in Table 5. The phase numbering corresponds to specified in Table 4. The energy consumption has been calculated from Figure 3 and 4 respectively using numerical integration. The phases of the second command in the chain are additionally marked with an apostrophe.
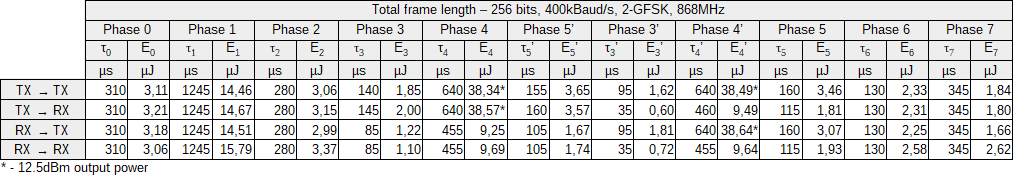
Changing the power of the transmitter
In the previous subsections, we assumed that the transmitter works with a maximum power of 12.5dBm, while the transmitter’s power output can be changed in a wide range. Table 6 presents the measurements of energy consumption for different transmitter power output levels. The energy measurement corresponds to Phase 4 from the previous subsection, POUT is the transmitter output power expressed in dBm declared by the chip manufacturer, PTX is the instantaneous power measured during Phase 4 according to the previous section.
Table 6. The energy consumption measurements for transmitting with different power output levels.
Hence, ETX can be expressed in more general way:![]() where
where ![]()
Changing the output power of the transmitter for the next frame does not require noticeable time and energy, because the required txPower parameter is stored and applied every time transmission of a frame starts to set an output power including temperature compensation coefficient. The transmit power level setting is carried out by the main core independently of the RF core by invoking CMD_SET_TX_POWER command using RF_runImmediateCmd() method which takes about 15μs on the MCU.
Changing the frequency/channel
Practical WSN applications use frequency hopping (FHSS) to spread signal over wide range of frequencies and to reduce interference with coexistent wireless technologies11. The FHSS is a method of switching a carrier among many frequency channels, using sequence known to both transmitter and receiver. The FHSS is widely used in the present standards, e.g. Bluetooth or IEEE 802.15.4e as a part of Time Slotted Channel Hopping12 (TSCH) – channel multiple access method. Therefore, changing the carrier frequency during frame sequences is necessary. The synthesizer frequency can be changed using CMD_FS radio operation command. Frequency calibration is performed during every CMD_FS command invocation. The measured energy consumption and duration are as follows: ![]() .
.
![]()
Nodes synchronization
The basic mechanism used to synchronize nodes in a synchronous duty-cycling technique is the broadcasting of special frames. Figure 5 presents the beacon frame format for the IEEE 802.15.4 standard. General PHY and MAC frame format of IEEE 802.15.4 can be found in 13. Measurements for the IEEE 802.15.4 standard were made for the SUN 2-FSK physical layer. The frame consisted of: SHR – 6 octets (4 octets – preamble, 2 octets – synchronization word), PHR – 2 octets, MHR – 12 octets (4 octets – addressing, 5 octets – security, known key), MSDU – 10 octets (8 octets – MIC:CCM-8), MFR – 2 octets.
Figure 5. The IEEE 802.15.4 beacon frame format.
Table 7. The CC1310 energy consumption while receiving and transmitting beacon for different bit rates.
Table 7 presents the energy consumption measurements for sending and receiving a beacon frame at different bit rates. It is worth noting that the amount of energy needed to receive the beacon at 400kBaud/s bit rate is only 3 times lower than at 8 times lower bit rate.
4. ENERGY MODEL
Figure 6. State diagram for the CC1310 energy model.
Based on the measurements, an energy model was derived. Figure 6 presents the model using the state diagram notation. States for the MCU and for the RF Core are presented separately and are enclosed in boundary with given core name. For each state, self-explanatory name was given along with energy consumption and time spent in this state. In some states, such as receiving or transmitting, the duration of the state and energy consumption are not fixed and depend on certain parameters, therefore the appropriate equations for their calculation are given. Five points of choice are considered for: RX/TX mode, setting new power output, setting new RF frequency, processing new radio command and finally to re-setup the whole RF unit. Between the WFI instruction and the RTC interrupt, the device is in STANDBY mode, where the energy consumption is approximately 2,9μW, according to the datasheet. In the model, we assume that immediately after waking up, the RF unit is turned on and remains active till the new duty cycle. On the other hand, the MCU may be turned off in case of its inactivity in accordance with power policy. MCU can transit between ACTIVE and IDLE states, the transition time is relatively short and equal to 14μs. It is worth noting that, especially at lower bitrates, MCU has an excess of computing power when compared to the time necessary to process RF commands, therefore MCU is considered to spend most of the time in deep sleep, saving energy. The total time spent on processing tasks in MCU is 150μs for the tested scenarios. This time was determined using the TI-RTOS Analyser included in the official SDK. The MCU spends the remaining time in deep sleep, idle mode (570uA, VDDS=3,6V). In the testing scenarios we do not perform any data processing or other operations related to the real stack implementation, therefore we can assume this time as minimum value required by TI-RTOS itself. Practical applications will execute complex and time consuming operations on the MCU therefore, energy required for task processing in the MCU (EMCU) should be considered. Based on these assumptions, the EMCU can be derived as the difference between the energy consumption in the active and the idle modes, and therefore can be expressed as:
![]() where
where ![]() is total time spent in active mode,
is total time spent in active mode, ![]() is clock speed in MHz,
is clock speed in MHz,![]() is supply voltage with DC-DC enabled. Thanks to DC-DC converter and assuming 48MHz clock speed
is supply voltage with DC-DC enabled. Thanks to DC-DC converter and assuming 48MHz clock speed ![]()
The RF Power-up states include performing all necessary settings of the RF unit, such as CMD_PROP_RADIO_DIV_SETUP and CMD_FS commands. The power-up time margin can be adjusted to certain application and environmental conditions. Synchronization between cores uses events mechanism and two of them are depicted on the state diagram RF_eventPowerUp and RF_eventCmdDone.
5. CONCLUSION
The presented methodology of deriving power consumption profiles of WSN nodes can be efficiently implemented within a simple testbed comprising appropriate software. The derived parameters assure higher accuracy in evaluation and optimization of the life span of nodes and the network in relation to various operational transmission schemes.
We found that the TI-RTOS overhead when compared to „bare-metal” application during the STANDBY → ACTIVE → STANDBY procedure is relatively small and equal to 10% in terms of time and 17% in terms of energy. The power-up radio procedure takes a lot of time and consumes a relatively large amount of energy that equals roughly to 18μJ, which is the equivalent of receiving a 42B frame at 400kBaud/s bitrate. Therefore, the node must be awoken about 1,9ms earlier than the scheduled time of transmission rendezvous. The used power save policies have to be aware of the total transition time, which is 2.3ms, when RF unit is taken into account. The CC1310 chip architecture, which uses 2 independent cores is extremely efficient and along with the possibility to completely turn off MCU, allows to save energy when processing RF commands. Storing the RF unit program along with its API in the special ROM memory is cost-effective but it does not allow for effective fixing bugs and further enhancement. When designing energy-aware MAC protocols, you need to consider the time necessary to transit between RX and TX modes. The time is not negligible and ranges from 140μs (RX→RX) to 250μs (TX→TX) depending on the transition sequence, whilst the energy ranges from 2.4μJ to 5,2μJ respectively. Changing the output power of a transmitter can lead to significant energy savings, transmission with minimum output power (-10dBm) consumes 2.7 times less energy than at maximum output power (12,5dBm). Moreover the output power can be easily changed before every frame and the energy needed to proceed this change is negligible. The frequency hopping mechanism is considered effective and energy to alter frequency is equal to 3,1μJ, which is the equivalent of receiving only a 7B frame at 400kBaud/s bitrate.
Further research is planned to use energy consumption parameters for developing self-adapting networks.
REFERENCES
[1] Liu, F., Wang, Y., Lin, M., Liu, K. and Wu, D., “A Distributed Routing Algorithm for Data Collection in Low-Duty-Cycle Wireless Sensor Networks,” IEEE Internet Things J. 4(5), 1420–1433 (2017).
[2] Li, F. and Wang, L., “Energy-aware routing algorithm for wireless sensor networks with optimal relay detecting,” Wirel. Pers. Commun. 98(2), 1701–1717 (2018).
[3] Wu, H., Zhang, L. and Miao, Y., “The Propagation Characteristics of Radio Frequency Signals for Wireless Sensor Networks in Large-Scale Farmland Las características de propagación de las señales de radiofrecuencia para redes de sensores inalámbricos en granjas de gran escala,” Wirel. Pers. Commun. 95(4), 3653–3670 (2017).
[4] Duan, J., Gao, D., Yang, D., Foh, C. H. and Chen, H. H., “An energy-aware trust derivation scheme with game theoretic approach in wireless sensor networks for IoT applications,” IEEE Internet Things J. 1(1), 58–69 (2014).
[5] Mafirabadza, C. and Khatri, P., “Efficient Power Aware AODV Routing Protocol for MANET,” Wirel. Pers. Commun. 97(4), 5707–5717 (2017).
[6] Rani, S., Ahmed, S. H., Talwar, R., Malhotra, J. and Song, H., “IoMT: A Reliable Cross Layer Protocol for Internet of Multimedia Things,” IEEE Internet Things J. 4(3), 832–839 (2017).
[7] Fedor, S. and Collier, M., “On the problem of energy efficiency of multi-hop vs one-hop routing in Wireless Sensor Networks,” Proc. – 21st Int. Conf. Adv. Inf. Netw. Appl. Work. AINAW’07 1, 380–385 (2007).
[8] More, A. and Raisinghani, V., “A node failure and battery-aware coverage protocol for wireless sensor networks,” Comput. Electr. Eng. 64, 200–219 (2017).
[9] Lee, C., Lindh, J. and Hernes, M., “Measuring Bluetooth® Low Energy Power Consumption,” Texas Instruments(2017), 1–24 (2015).
[10] “CC26x0, CC13x0 SimpleLinkTM Wireless MCU Power Management Software Development Reference Guide.”, (2017).
[11] Zoppi, S., Gürsu, H. M., Vilgelm, M. and Kellerer, W., “Reliable hopping sequence design for highly interfered wireless sensor networks,” IEEE Work. Local Metrop. Area Networks 2017–June, 0–6 (2017).
[12] Du, P. and Roussos, G., “Adaptive time slotted channel hopping for wireless sensor networks,” 2012 4th Comput. Sci. Electron. Eng. Conf. CEEC 2012 – Conf. Proc., 29–34 (2012).
[13] Kozłowski, A. and Sosnowski, J., “Analysing efficiency of IPv6 packet transmission over 6LoWPAN network,” Proc. SPIE, Photonics Appl. Astron. Commun. Ind. High Energy Phys. Exp. 10445, 104451J (2017).